How Reading the Wrong Book Led Me to Netflix
21 Sep 2024Background
In 2020, during the COVID pandemic I had moved into a leadership role at Braintree and it was the first time I really thought about trying to define “my leadership style”. My entire career, I’ve focused on “doing the right thing” and doubling down on whatever existing intuition I had built from watching others. But for this exercise, I tried to divorce my current style from one that I’d want to lead with. Simply, I started from zero. I did the zero-to-leadership book list that everyone has probably gone through, you know:
- The 7 Habits of Highly Effective People
- How to Win Friends and Influence People
- The Five Dysfunctions of a Team
- Leaders Eat Last
- The Lean Startup
- The Phoenix Project
- Mythical Man Month
- Deep Work
- The Innovators Dilemma
- Working Backwards
- Extreme Ownership
- Good to Great
There were more but you get the idea. The most fortuitous (maybe comical?) moment for me is that I read Managing Up by Rosanne Badowski when in reality what was actually recommended to me was Managing Up (by Mary Abbajay). But by reading Roasanne Badowski’s book, I learned of Jack Welch and that started me down a whole different path, centered on a guy I really knew nothing about. And I couldn’t stop pulling at this thread - I read Winning and Straight from the Gut and I watched these interviews (vid1, vid2) a dozen times. Jack Welch and I had similar childhoods in suburban Massachusetts, he had a paper route (so did I), he caddied during the summers (so did I) but somehow after high school he went on to become the youngest CEO ever at GE (at age 30) and I, well, didn’t. Fascinating stuff, highly recommend those books if you’re interested in one of the most influential (and sometimes controversial) CEO’s of the 20th century.
So, like any good engineer I am in an information gathering mode and I’m going full bore. In case you’re not familiar with Jack Welch, he wrote the playbook on how a company should set values and then hold people accountable to them. So that leads me to Netflix’s Culture Doc which is exactly what Jack Welch would have wanted, it’s filled with behaviors and values that are easy to understand but set the culture in a big way. I was convinced that I would fit in at Netflix, that those values were what I wanted too, and after browsing their job board for a few months, I realized something…
Netflix’s Job Board
Netflix’s job board is basically set up with a front end displaying a search bar and a table of jobs. Open your network inspector, type a search term and hit Go and you’ll see the entire page is powered by a simple GET request to
https://jobs.netflix.com/api/search?q={search_term}
The response comes backs in JSON. *Note that as of 2024, this API still works but I can see now that the website is using a new endpoint via explore.jobs.netflix.net.
So I thought, well maybe the best way to get a highly coveted job at Netflix was to be the first to know about it, and then be the first to apply!
Job Search Lambda
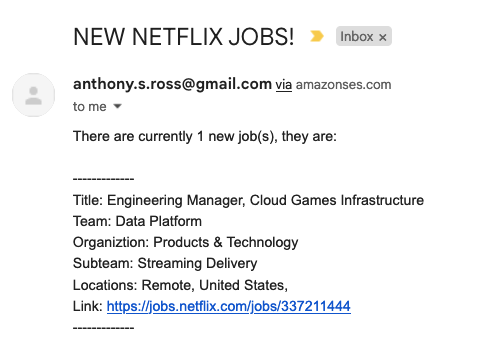
I built a very simple serverless ruby application that runs a few times a day, looking for anything matching “engineering manager” and if it finds something, it will send me an email that looks like this:
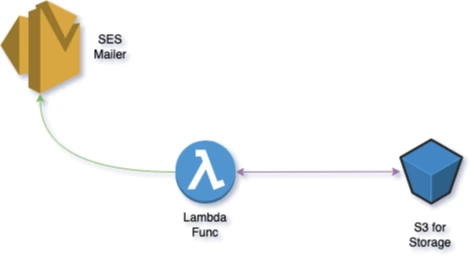
The architecture and code is very simple:
- A CloudWatch Event triggers the lambda every 4 hours (managed by serverless)
- The lambda makes a GET request to the Netflix API
- It goes to S3 to see if it has seen this job before
- If it hasn’t, it sends me an email via SES
You can find all the code in the repo. Including an Easter egg in my User-Agent string that I thought someone at Netflix might see and get a chuckle out of.
Results
So this has been running now since May 27th, 2021 and while I have moved on with my life (and possibly found my leadership style - another post coming) I still get the emails. Not only do I still get emails but I’ve been storing the results of the API the entire time because I wanted the lambda to only email me if there were new jobs that I hadn’t seen before.
I’ve got 3+ years of data now and I thought it be intresting to look at some trends.
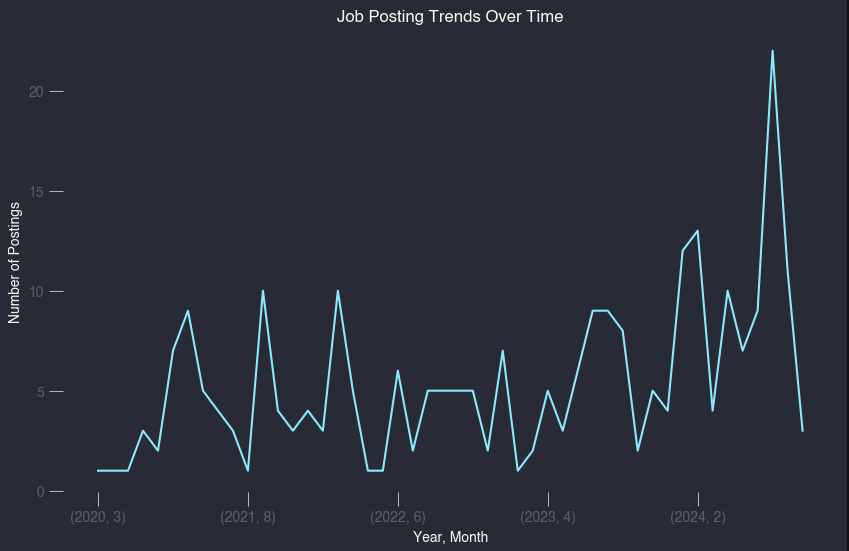
Netflix EM Job Trends
First, I think it’s worth calling out that job postings over time are on a continuum but are mostly trending up, especially in the earlier part of this year. Here’s what that looks like:
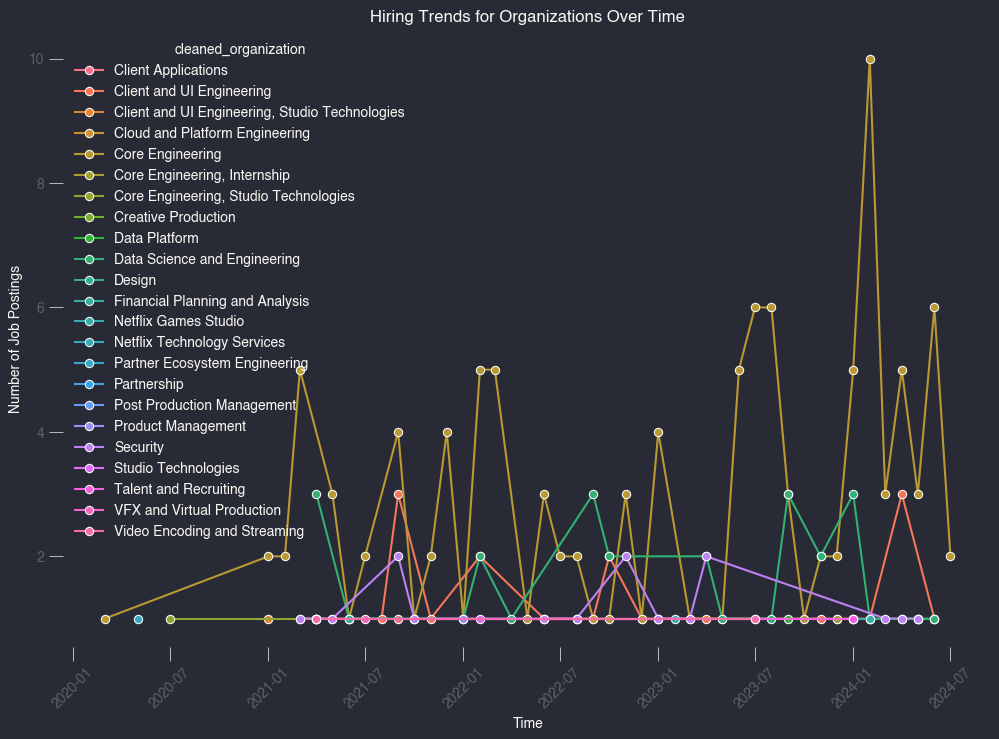
Netflix Org Trends
Looking at trends over time, gives us a view into what Netflix is investing in and how that translates into jobs. My search focused on “engineering manager” roles so one can assume that these roles, are a leading indicator into org changes and growth (each EM likely has 5-10 direct reports, so a single EM role could be 5-10x new IC roles). Sure some might be backfills because of attrition or performance issues but I think the data is still interesting.
The top 3 teams/organizations for the last 3 years are:
- Core Engineering - 117+ EM roles
- Data Science & Engineering - 29+ EM roles
- Client and UI Engineering - 24+ EM roles
Here’s what that looks like over time:
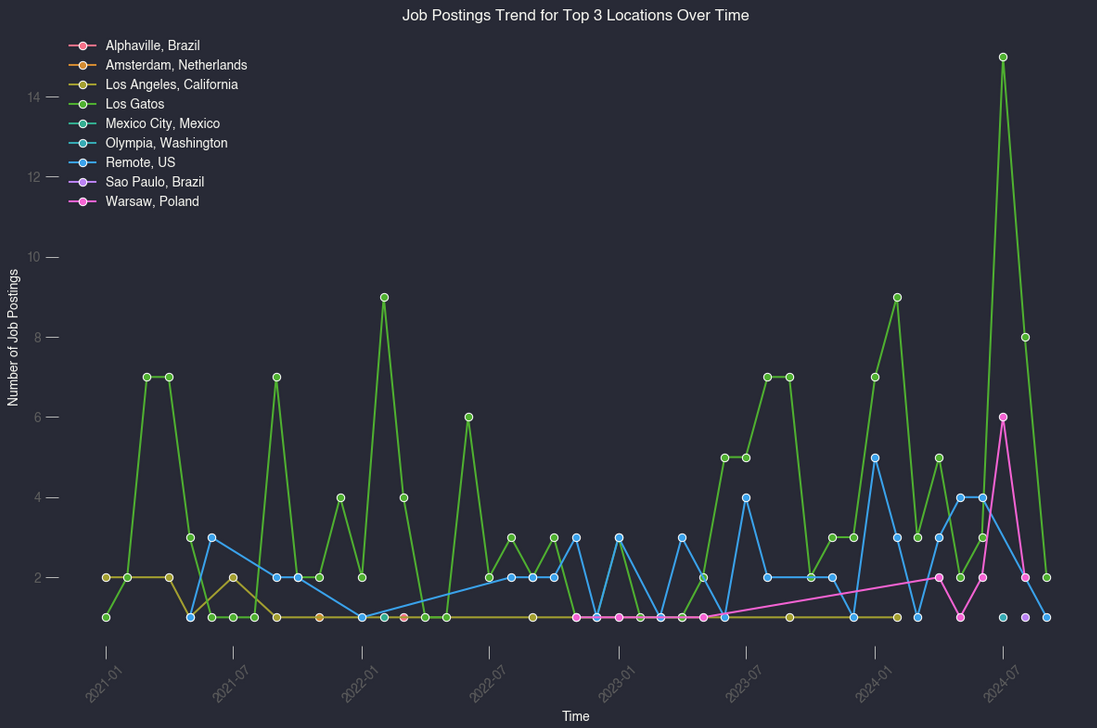
Netflix Location Trends
Next, I thought it would be interesting to see where these jobs are located. Here’s what that looks like:
- Los Gatos, CA - 166+ EM roles
- Remote - 51+ EM roles
- Warsaw, Poland - 16+ EM roles
We can see a small bump in remote roles over time but Los Gatos is still where the majority of hiring is taking place.
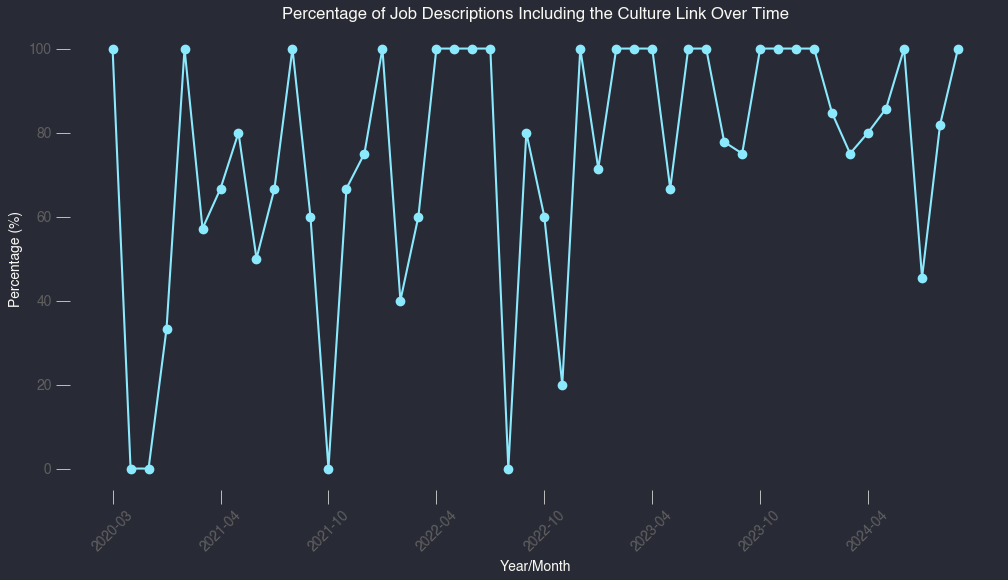
Culture in Descriptions
Next, I thought it was important to see how many job descriptions reinforced the Netflix culture and there are a few ways I tried to look at this.
First, how many job descriptions directly link to the culture doc. There was an early dip but this is trending up:
# Group by year/month and calculate total job descriptions and those including the culture link
grouped = df.groupby('year_month').agg(
    total_jobs=('cleaned_description', 'size'),  # Total number of jobs
    jobs_with_culture_link=('includes_culture_link', 'sum')  # Number of jobs with culture link
)

# Calculate the percentage of job descriptions with the culture link
grouped['percentage_with_culture_link'] = (grouped['jobs_with_culture_link'] / grouped['total_jobs']) * 100

print(grouped[['total_jobs', 'jobs_with_culture_link', 'percentage_with_culture_link']].head())

# Plot the trend over time
# Convert the PeriodIndex to strings - why do i always have to do this?
grouped.index = grouped.index.astype(str)

plt.plot(grouped.index, grouped['percentage_with_culture_link'], marker='o')
plt.title('Percentage of Job Descriptions Including the Culture Link Over Time')
plt.xlabel('Year/Month')
plt.ylabel('Percentage (%)')
plt.xticks(grouped.index[::6], rotation=45)
plt.show()
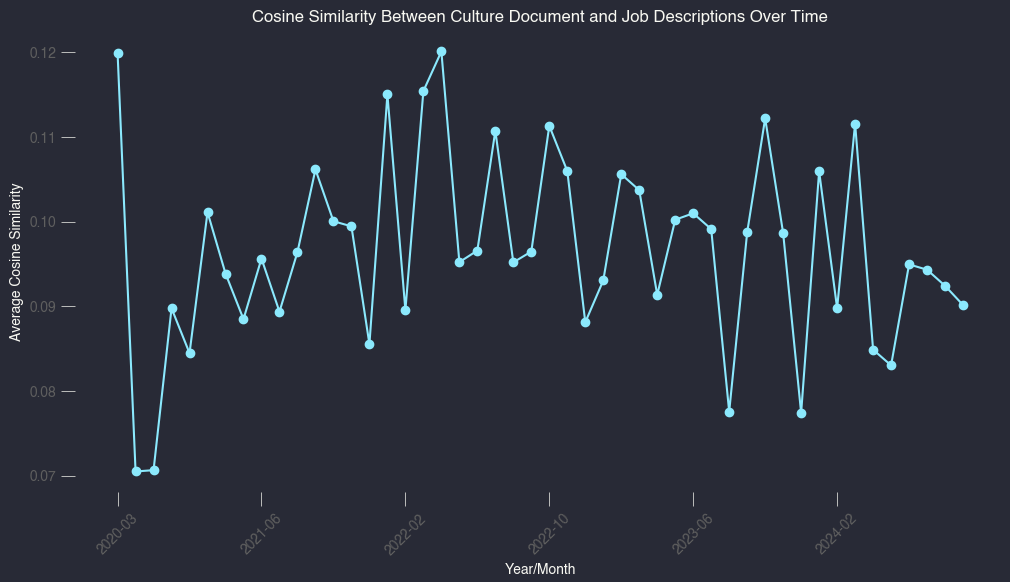
Culture Embedding
Links are good, but I was also curious if culture words and phrases were being embedded in the job descriptions. I removed stop words and then compared using cosine similarity the job description to the culture doc. Here’s what that looks like:
tfidf_vectorizer = TfidfVectorizer()

# Fit the vectorizer on both the culture document and job descriptions
tfidf_matrix = tfidf_vectorizer.fit_transform([cleaned_culture_doc] + df['cleaned_description'].tolist())


# Calculate the cosine similarity between the culture document and each job description
cosine_similarities = cosine_similarity(tfidf_matrix[0:1], tfidf_matrix[1:])

df['cosine_similarity'] = cosine_similarities[0]

# Group by year/month to see how the similarity changes over time
similarity_trend = df.groupby('year_month')['cosine_similarity'].mean()
similarity_trend.index = similarity_trend.index.astype(str)

plt.plot(similarity_trend.index, similarity_trend.values, marker='o')
plt.title('Cosine Similarity Between Culture Document and Job Descriptions Over Time')
plt.xlabel('Year/Month')
plt.ylabel('Average Cosine Similarity')
plt.xticks(similarity_trend.index[::8], rotation=45)
plt.show()
Conclusion
Netflix is very good about putting their values first and while Netflix’s culture isn’t for everyone, I think Jack Welch would have been proud and likely thought it was wicked smaht.